Netherlands
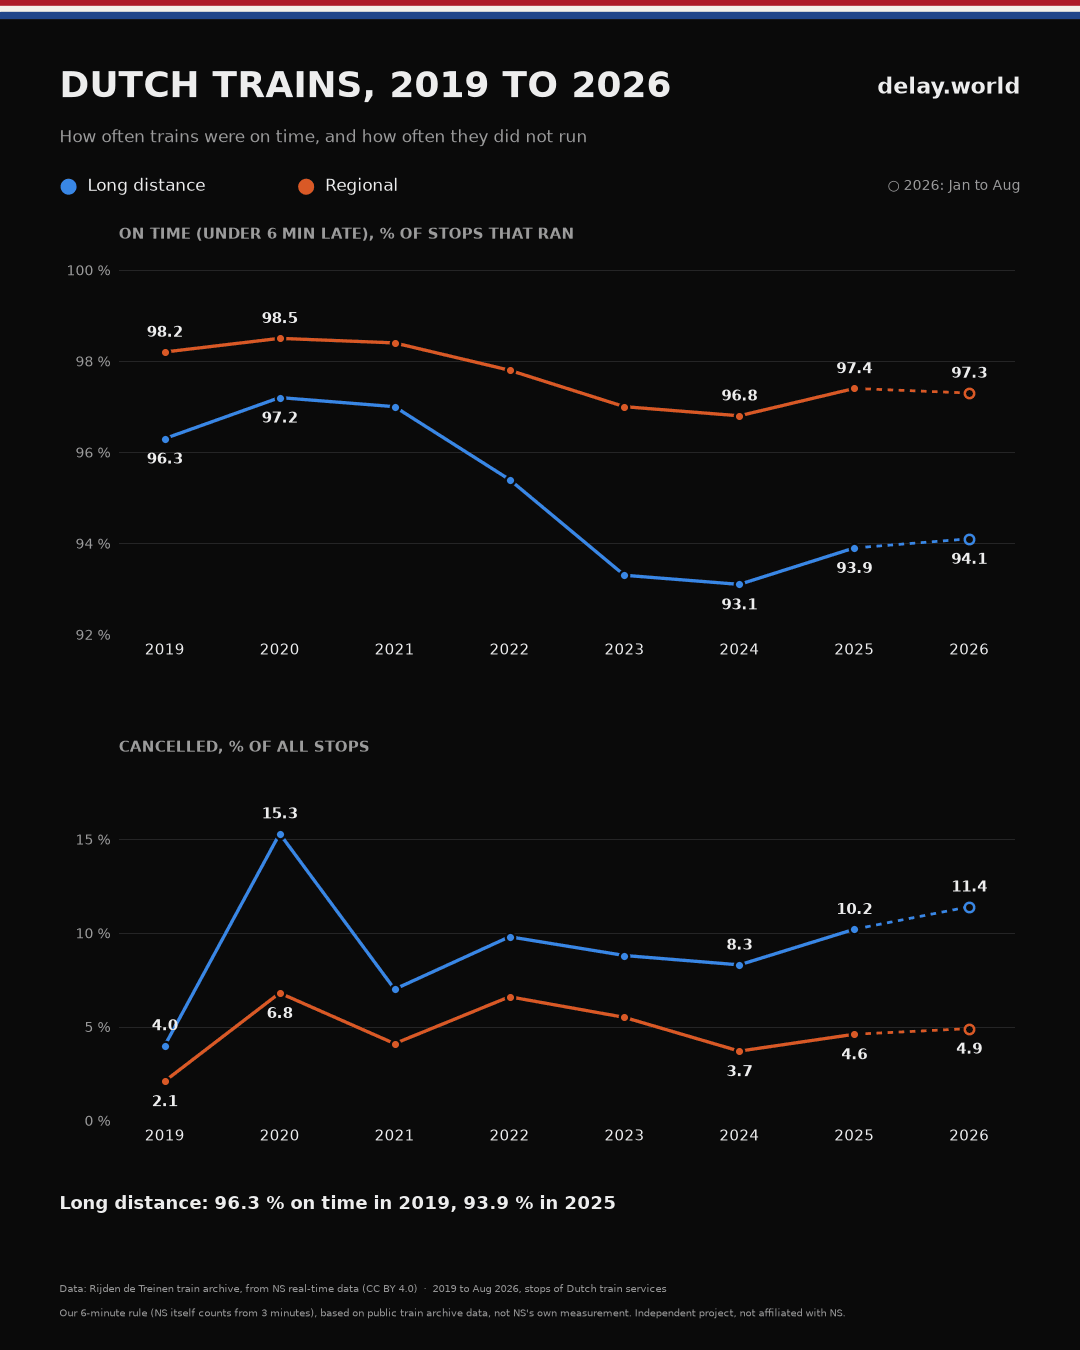
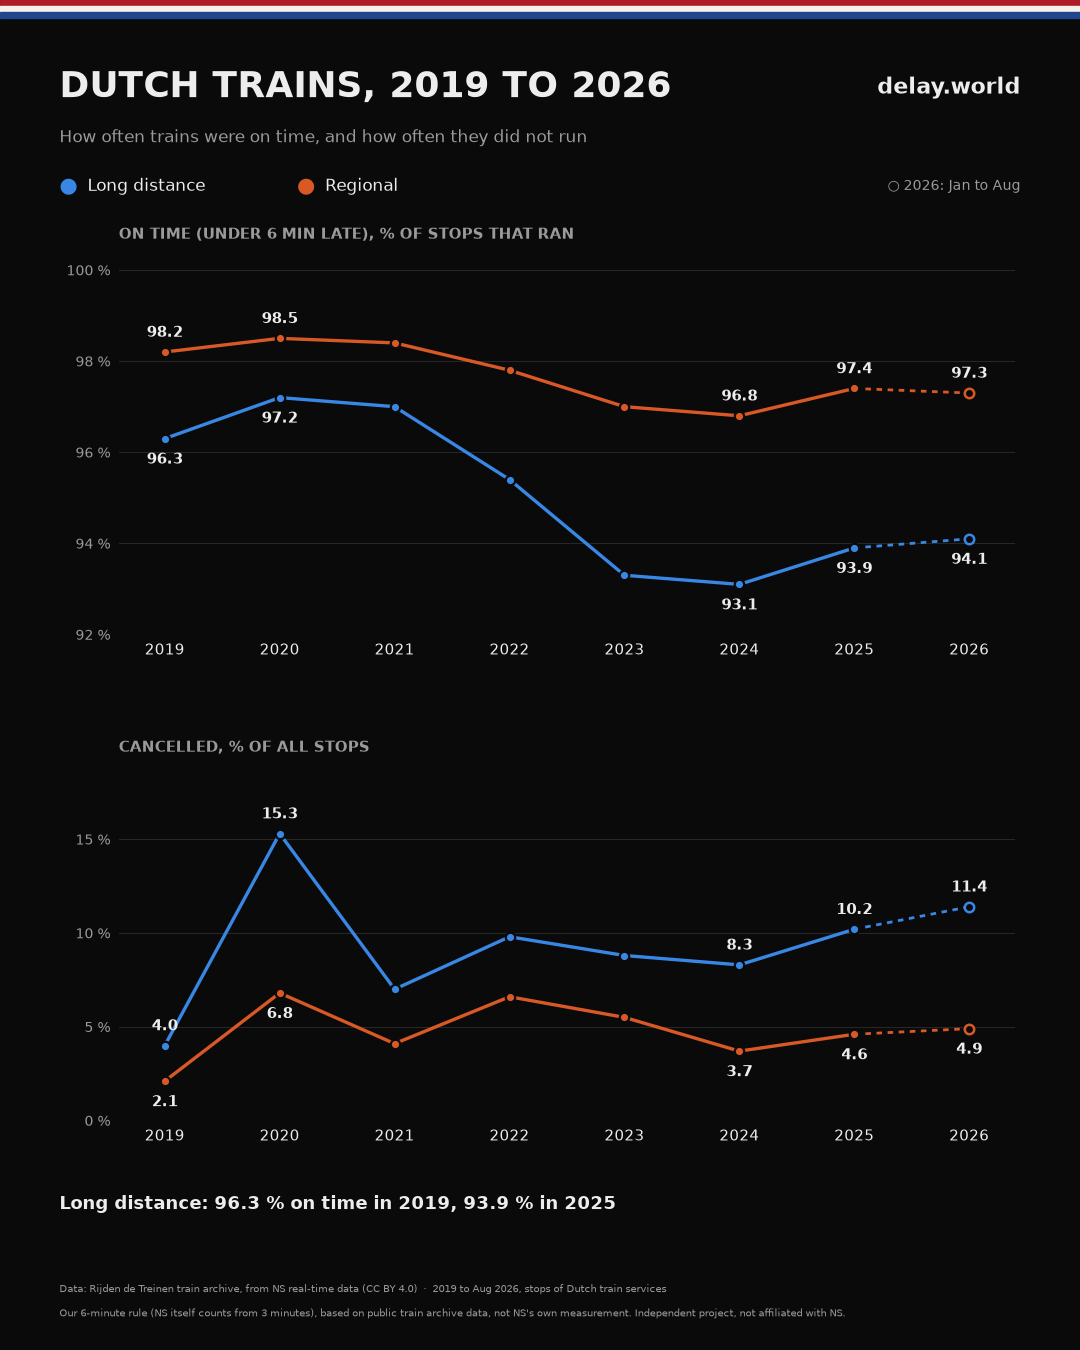
How punctual have Dutch trains been since 2019? On long distance, the share of on-time stops fell from 96.3 % (2019) to 93.9 % (2025). Regional trains stayed steadier.
How to read the map
- on time (under 6 min)
- 6 to 14 min late
- 15 to 29 min late
- 30 to 59 min late
- 60+ min late
- cancelled
One day as a video
The numbers
| Year | Long distance | Regional | ||
|---|---|---|---|---|
| On time (under 6 min) | Cancelled | On time (under 6 min) | Cancelled | |
| 2019 | 96.3 % | 4.0 % | 98.2 % | 2.1 % |
| 2020 | 97.2 % | 15.3 % | 98.5 % | 6.8 % |
| 2021 | 97.0 % | 7.0 % | 98.4 % | 4.1 % |
| 2022 | 95.4 % | 9.8 % | 97.8 % | 6.6 % |
| 2023 | 93.3 % | 8.8 % | 97.0 % | 5.5 % |
| 2024 | 93.1 % | 8.3 % | 96.8 % | 3.7 % |
| 2025 | 93.9 % | 10.2 % | 97.4 % | 4.6 % |
| 2026 * | 94.1 % | 11.4 % | 97.3 % | 4.9 % |
* 2026: January to August only
The trend since 2019
Download the chart as an image
Provinces compared
How punctual are trains in each province? We count stops at stations in the province, separately for long distance and regional.
Long distance
| Province | Stops | On time | Cancelled |
|---|---|---|---|
| Groningen | 21,752 | 96.3 % | 7.0 % |
| Fryslân | 43,233 | 96.2 % | 6.4 % |
| Zeeland | 199,254 | 95.7 % | 13.4 % |
| Drenthe | 43,618 | 95.1 % | 7.0 % |
| Zuid-Holland | 775,517 | 94.6 % | 11.3 % |
| Utrecht | 312,840 | 94.4 % | 12.1 % |
| Gelderland | 280,468 | 94.4 % | 11.2 % |
| Overijssel | 288,796 | 94.2 % | 8.6 % |
| Noord-Holland | 1,155,546 | 93.9 % | 10.7 % |
| Limburg | 215,831 | 93.7 % | 12.8 % |
| Noord-Brabant | 437,725 | 93.4 % | 14.5 % |
| Flevoland | 88,287 | 93.3 % | 8.2 % |
Regional
| Province | Stops | On time | Cancelled |
|---|---|---|---|
| Groningen | 818,766 | 98.3 % | 3.7 % |
| Overijssel | 901,968 | 98.2 % | 3.0 % |
| Limburg | 949,432 | 97.7 % | 4.3 % |
| Fryslân | 466,978 | 97.7 % | 3.2 % |
| Gelderland | 1,735,592 | 97.6 % | 3.9 % |
| Drenthe | 195,627 | 97.6 % | 2.7 % |
| Utrecht | 1,268,228 | 97.5 % | 5.2 % |
| Flevoland | 332,097 | 97.4 % | 5.0 % |
| Zuid-Holland | 1,840,333 | 97.2 % | 5.4 % |
| Noord-Holland | 2,177,188 | 97.0 % | 5.8 % |
| Noord-Brabant | 834,977 | 96.8 % | 5.6 % |
| Zeeland | 13,010 | 96.6 % | 5.7 % |
Period: November 2025 to August 2026 without July. On time = under 6 minutes late, counted over the stops that ran. Cancelled = share of all stops. Stops at stations abroad are not included. Few stops (Zeeland, regional) make a value less certain. Based on public train archive data, not NS's own measurement. Boundaries: Kadaster (CC BY 4.0).
The 30 biggest rail cities
The 30 cities with the most train stops that also have long-distance service, ordered by punctuality (all train classes together).
| City | Stops | On time | Cancelled |
|---|---|---|---|
| Enschede | 136,004 | 98.4 % | 3.4 % |
| Groningen | 293,199 | 98.0 % | 4.5 % |
| Heerlen | 126,721 | 97.8 % | 5.3 % |
| Zwolle | 217,134 | 97.7 % | 4.7 % |
| Haarlem | 153,557 | 97.7 % | 5.2 % |
| Sittard-Geleen | 125,254 | 97.7 % | 5.5 % |
| Maastricht | 156,479 | 97.6 % | 6.5 % |
| Leeuwarden | 159,116 | 97.3 % | 4.0 % |
| Leiden | 233,573 | 97.2 % | 7.6 % |
| Ede | 149,498 | 97.2 % | 5.7 % |
| Den Haag | 481,260 | 97.0 % | 7.8 % |
| Nijmegen | 258,204 | 97.0 % | 7.8 % |
| Utrecht | 672,472 | 96.9 % | 7.3 % |
| Gouda | 197,253 | 96.8 % | 7.6 % |
| Almere | 340,038 | 96.7 % | 5.5 % |
| Dordrecht | 221,515 | 96.5 % | 6.9 % |
| Amersfoort | 285,534 | 96.4 % | 6.7 % |
| Arnhem | 277,968 | 96.3 % | 6.5 % |
| Delft | 158,873 | 96.0 % | 7.9 % |
| Haarlemmermeer (incl. Schiphol) | 413,701 | 95.9 % | 6.4 % |
| Tilburg | 147,764 | 95.9 % | 10.0 % |
| Eindhoven | 164,456 | 95.8 % | 8.8 % |
| Hengelo | 124,097 | 95.7 % | 5.1 % |
| Amsterdam | 1,258,273 | 95.5 % | 8.6 % |
| Zaanstad | 241,832 | 95.5 % | 8.9 % |
| Hilversum | 170,630 | 95.3 % | 5.1 % |
| 's-Hertogenbosch | 191,255 | 95.1 % | 12.5 % |
| Rotterdam | 482,806 | 94.9 % | 8.8 % |
| Venlo | 122,701 | 94.1 % | 7.3 % |
| Breda | 114,030 | 94.0 % | 11.7 % |
Period: November 2025 to August 2026 without July. A city is the municipality of the station; Schiphol belongs to Haarlemmermeer. Municipalities with regional trains only are not included. Based on public train archive data, not NS's own measurement.
On time = under 6 minutes late, counted over the stops that ran. Cancelled = share of all stops. This is our 6-minute rule; NS itself counts from 3 minutes. Based on public train archive data, not NS's own measurement.
Data: Rijden de Treinen, train archive (rijdendetreinen.nl/en/open-data/train-archive), from NS real-time data, licence CC BY 4.0. Analysed and summarised by us. Independent project, not affiliated with NS or Rijden de Treinen.